
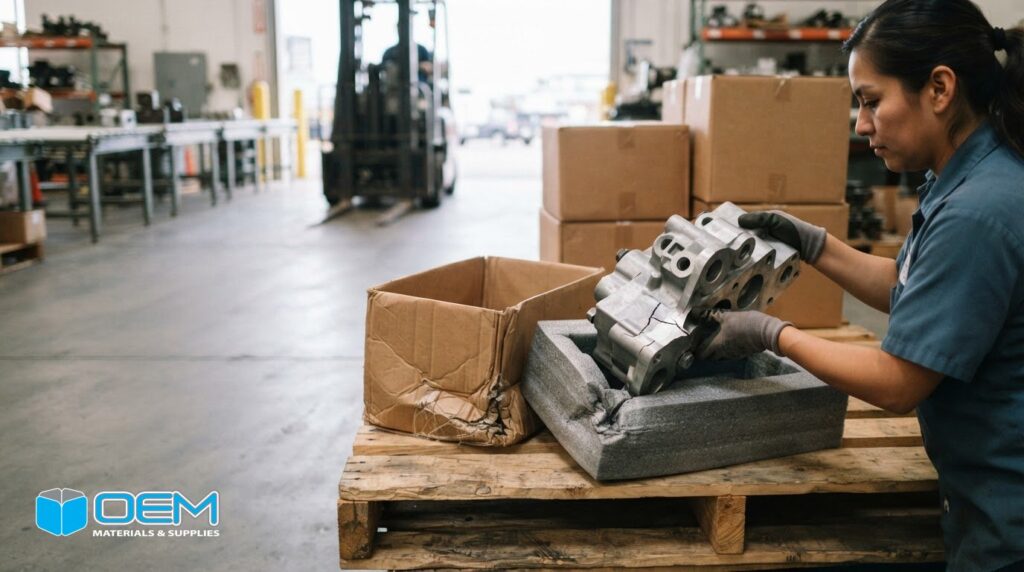
Up to 11% of unit loads arriving at distribution centers experience some degree of damage. The financial impact of product damage in transit goes beyond the value of the goods: it can include replacement freight, handling and administrative work, lost sales, and pressure on customer relationships. The exact cost depends on what is damaged and what it takes to recover, replace, or repair it.
Packaging and freight costs are visible on an invoice, but damage can create less obvious expenses across operations. For manufacturers and distributors in Orange County, Los Angeles, San Diego, and Riverside, recurring damage can also undermine customer confidence and invite closer scrutiny from insurers and shipping partners.
This article explains how to measure direct and indirect costs, why damage rates vary by shipment type, and how lost sales and reputational harm add to the total. It also shows how packaging design and handling practices can reduce exposure, helping purchasing and operations teams assess tradeoffs using a total-cost perspective.
Key Takeaways
- Measure damage by its full recovery cost, including replacement handling and administrative work, not just the value of the damaged item.
- Use shipment and damage records to identify where losses are affecting inventory, sales, and customer relationships.
- Review packaging, storage, palletizing, and handling together to identify preventable sources of damage.
- Recurring losses can draw greater scrutiny from insurers and shipping partners, making consistent documentation important.
- Match packaging protection to the product and shipping conditions to balance damage risk with material and operating costs.
What’s the Real Cost of In-Transit Damage?
Transit damage costs more than the value of a broken item. Packaging performance, warehouse handling, and transportation conditions all influence the final loss.
Annual Retailer and Manufacturer Damage Costs
Annual damage costs include damaged goods and the expense of replacing, processing, or disposing of them. These figures show why buyers should assess damage across the supply chain, not treat it as an isolated freight expense.
For a manufacturer, a damaged component can delay a customer’s production line and strain a supplier relationship. A retailer may lose sellable inventory or have to process a return. The effect on an operation depends on its products, shipment volumes, and recovery process.
Packaging and Handling Damage Prevention
Protective packaging is chosen to limit product movement and impact forces in transit. A fragile component may need cushioning that holds it in place, while a heavy item may need a stronger shipping carton. An oversized box with insufficient filler can let the product shift and increase damage risk.
Compare packaging improvements and prevention programs with the full cost of the damage they could prevent. Track damage frequency and related replacement, return, and handling expenses, then compare those costs with added packaging and program costs. The return on investment depends on product dimensions, materials, and shipping requirements.
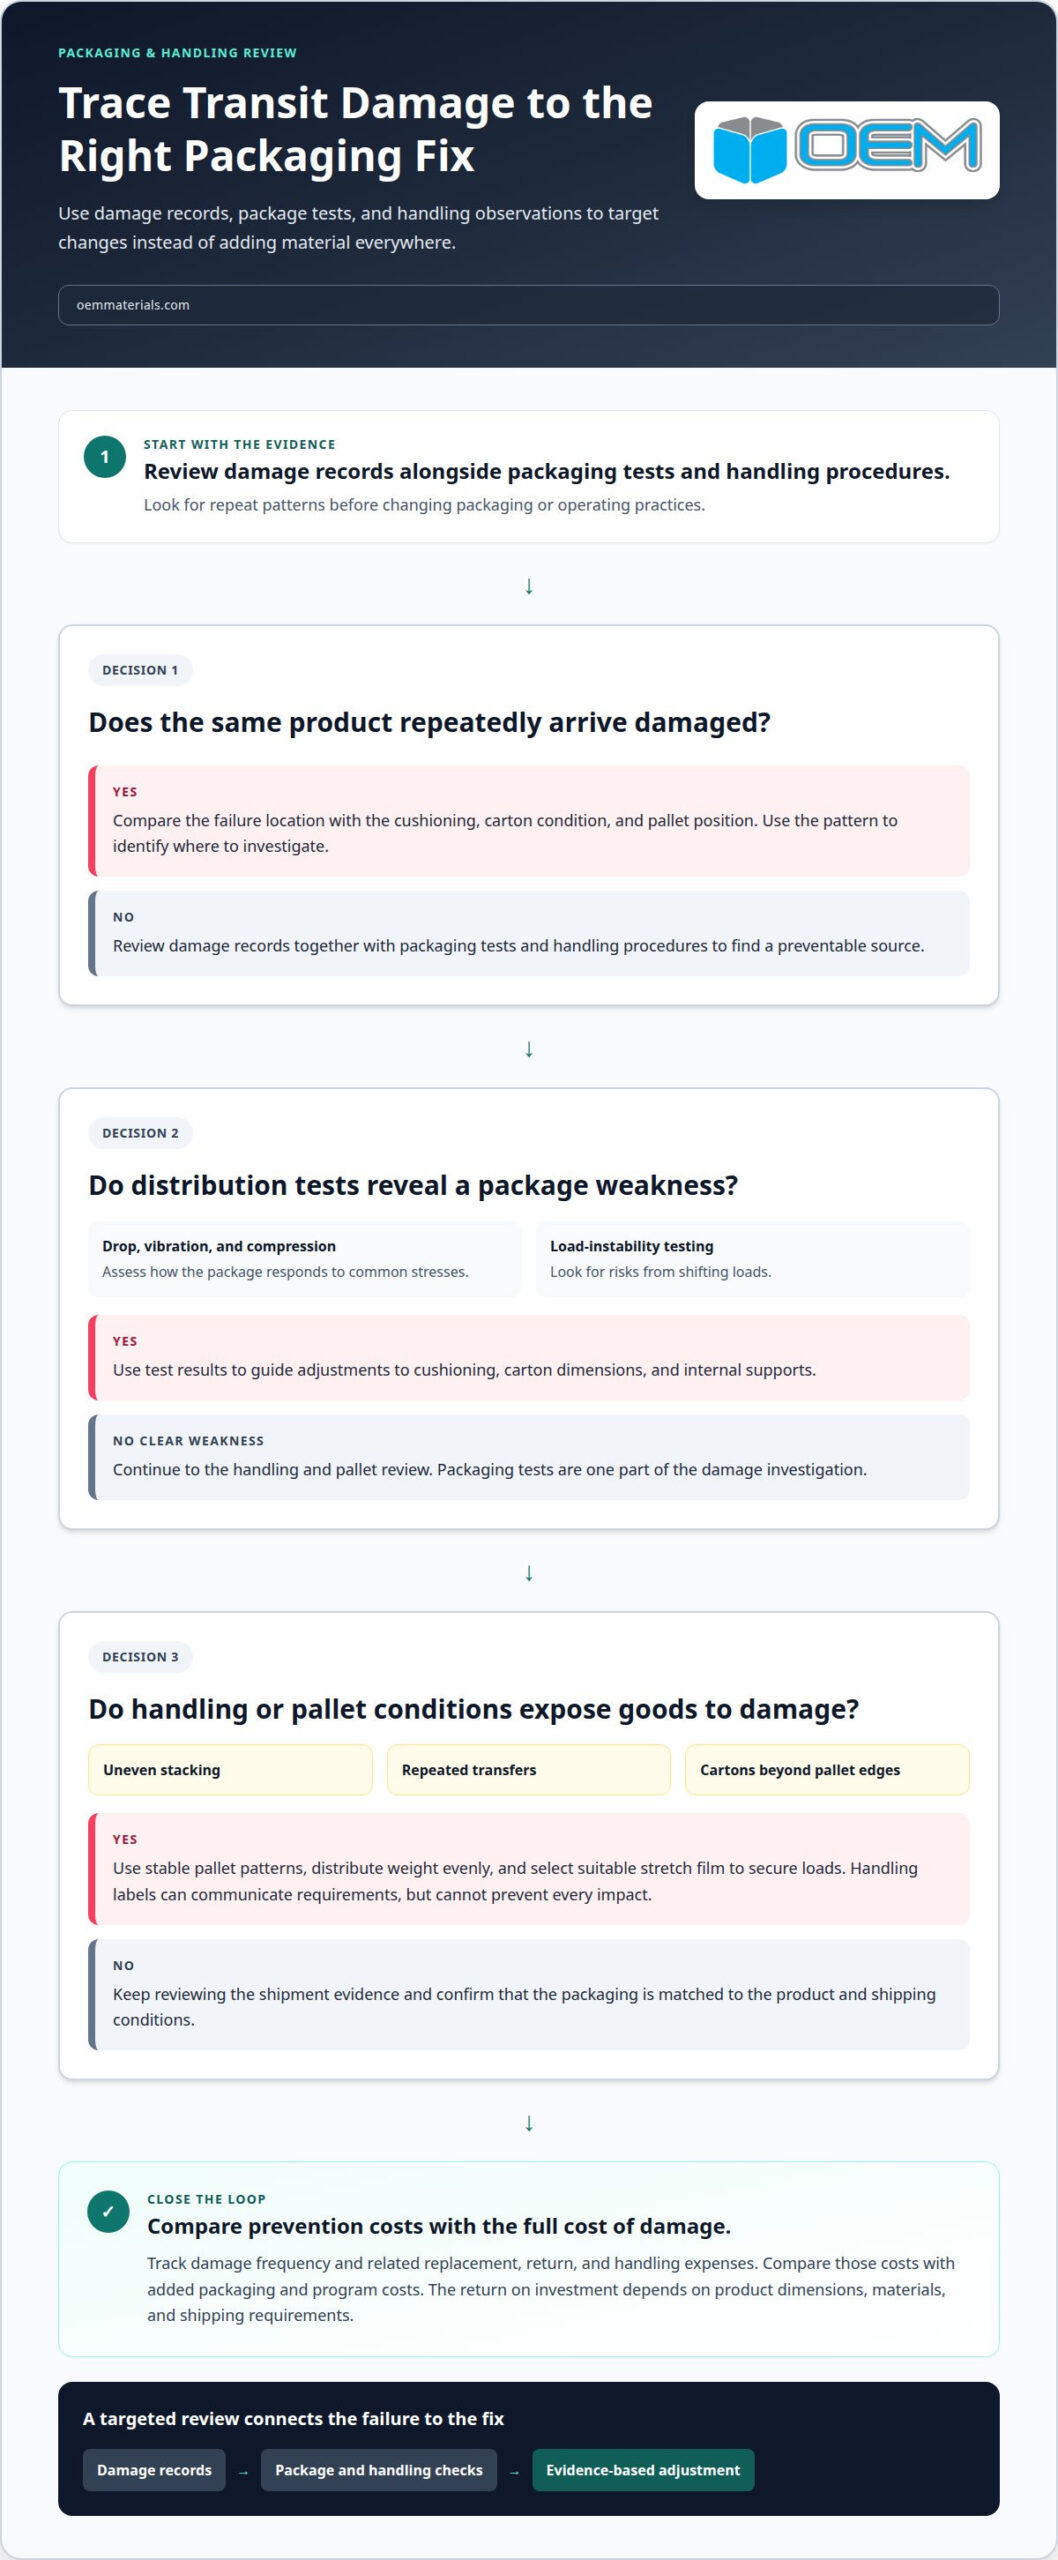
Testing under distribution conditions can reveal weaknesses before routine shipments expose them. Drop, vibration, and compression tests assess how a package responds to common stresses, while load-instability testing can identify shifting risks. Use the results to guide adjustments to cushioning, carton dimensions, and internal supports.
Packaging design should match the product and its route. For example, protective inserts can reduce movement around delicate parts, while stronger boxes can support heavier shipments. Tailored packaging design can address product dimensions and shipping conditions without relying on excess material as the only safeguard.
Handling practices matter before a shipment reaches a carrier. Uneven stacking, repeated transfers, and cartons extending beyond pallet edges can expose goods to impacts or compression. Stable pallet patterns, even weight distribution, and suitable stretch film help secure loads. Handling labels can communicate requirements, but cannot prevent every impact.
Review damage records alongside packaging tests and handling procedures. If the same product repeatedly arrives damaged, compare the failure location with the cushioning, carton condition, and pallet position. This evidence helps teams target a specific change instead of increasing material use for every shipment.
What are the Measurable Costs of In-Transit Damage?
Measure each damaged unit by its full recovery cost, not just its purchase or sale value. Replacement, return freight, labor, and claims administration can all add expense.
Direct and Indirect Freight Damage Costs
Direct and indirect freight damage costs include the product loss and the expenses of resolving it. This distinction matters because a unit’s replacement value alone can understate its financial impact.
To measure the financial impact of product damage in transit, record product cost, missed margin, original freight, replacement shipment, inspection, and repackaging. Add customer service time, claims administration, storage, and disposal where applicable. A specialized item may also need repair and further testing before resale.
Indirect costs can disrupt production schedules and customer commitments. If a damaged component delays a customer’s line, the supplier may face contractual reimbursement obligations. Insurance may not cover every loss, and replacement costs may be due before a claim is settled. That timing can create cash-flow pressure beyond the original damage.
Replacement and Return Handling Expenses
Replacement and return handling costs cover the freight and labor needed to recover from damage. They matter because one damaged shipment can trigger several handling steps beyond the initial delivery.
A replacement may require picking another unit, preparing it for shipment, and arranging outbound freight. The damaged item may also need return freight, inspection, sorting, and repackaging. A return and replacement may require as many as two additional shipments after the original.
Not every damaged product needs replacing. Repair may preserve its value, but specialized or high-value goods can require costly work and further testing before resale. Documenting repair, discount, and disposal decisions helps distinguish recoverable inventory from a total loss.
Claims and Coverage Expenses
Claims and coverage costs include documentation, customer communication, and insurance expenses related to seeking recovery. They matter because even a valid claim requires staff time and organized records.
Use the carrier terms and shipment agreement to identify the filing deadline. Report damage promptly and retain the bill of lading, delivery receipt, photographs, invoices, inspection findings, and replacement or repair records. These materials support the claimed loss and help clarify responsibility.
Freight insurance and declared-value coverage have no single standard cost. Premiums and fees depend on shipment value, route, coverage terms, and the transit conditions accepted by the insurer. Include coverage costs in the shipment’s total-cost review rather than treating insurance as a substitute for damage prevention.
Damage Costs Within Transportation Spend
Damage costs as a share of transportation spend show how losses affect the wider freight budget. This measure helps operations teams compare damage exposure with transportation costs.
Damage-related expenses can account for 1% to 3% of an individual shipper’s total transportation spend. U.S. businesses incur millions of dollars in damage costs each year, but no single average per damaged unit applies across products and shipping conditions.
A complete view of the financial impact of product damage in transit comes from comparing damage records with shipment volume, recovery expenses, and freight spend. The resulting cost per damaged unit gives purchasing and operations teams a consistent basis for evaluating packaging changes. For an estimate tailored to product and shipment details, submit a packaging quote request.
Lost sales, market share, and brand reputation
Transit damage can reduce sellable inventory and weaken customer confidence. The losses may extend beyond one order, affecting future purchases and supply chain relationships.
Lost Sales and Reputation Effects
Lost sales and reputation effects arise when damaged deliveries reduce available inventory or make customers less confident in a supplier. They matter because a shipment problem can affect both current revenue and future demand.
For the average retailer, returns account for 4.4% in lost revenue from items that cannot be resold or must be discounted. Damaged inventory can also leave distribution channels short of products customers expected to buy. A delayed replacement may shift demand to another seller or disrupt a business customer’s production schedule.
In the United States, 79% of consumers will not repeat a purchase if their delivery is damaged. The reputational effect can follow a company across later orders, even after a refund or replacement resolves the immediate issue. Each damaged delivery can therefore affect customer relationships as well as logistics performance.
Brand effects can build across a supply chain. Forty-one percent of consumers report a negative impact on brand image when a shipment is lost, delayed, or damaged. Thirty-nine percent of brands experience reduced customer loyalty under those conditions. For manufacturers, repeated damage may weaken confidence between suppliers and business customers.
Inventory write-offs add another consequence. A product that cannot be sold at full value may be discounted, repaired, or removed from available stock. In U.S. accounting, document damaged inventory and its disposition; tax treatment depends on applicable accounting methods and supporting records. Distinguish goods written off from items repaired, returned, or resold at a discount.
Returns, Refunds, and Customer Retention
Returns, refunds, and customer retention costs arise when buyers seek a remedy for damaged goods. They matter because resolving a return may not restore the customer’s confidence or future business.
A damaged order may lead to a refund, replacement, or discount, while the returned product needs assessment before resale. For example, a retailer may have to discount an item whose packaging damage prevents it from being sold at full value. The remedy resolves the transaction, but lost margin and return processing still affect results.
Track return reasons alongside damage reports, refund decisions, and repeat-purchase behavior. An increase in damage-related returns may point to a product, shipment route, or distribution step that needs review. Separating those returns from other customer service issues helps teams assess how transit damage affects retention.
Apply the same review to business-to-business accounts. If a damaged component disrupts a customer’s production schedule, the impact may include strained supplier relationships and reduced confidence in future deliveries. Compare damage records with account complaints and reorder patterns to identify where logistics problems may affect market share.
Common causes of product damage in transit
Transit damage can begin in a warehouse, before a shipment reaches a truck. Vibration, compression, poor storage, and inadequate packaging can combine to damage goods.
Transportation mode changes exposure. Less-than-truckload shipments typically have freight damage rates of 2% to 5%, compared with 0.5% to 2% for truckload shipments. Intermodal rates range from 1% to 3%, depending on transfers. Each transfer creates another opportunity for a carton to be moved, stacked, or exposed to impact.
Vibration during truck or parcel transport can shift a product inside its carton. Repeated movement may loosen a component or make it rub against the packaging. For example, an item with excess clearance inside its box can repeatedly strike the carton walls. Visible damage may seem minor even when internal movement affects function or finish.
Compression damage often starts with unstable stacking. Uneven loads or cartons extending beyond pallet edges can leave lower cartons under uneven pressure. Warehouse storage and stacking can also crush packaging before loading. Check for crushed corners, bowed panels, or repeated damage at the same pallet position to help locate the failure point.
Packaging and load restraint can contribute to shifting. Incorrect stretch-film application, insufficient containment force, or a poor pallet pattern may let cartons move during transit. Appropriate cushioning materials can limit movement around a product, while packaging that leaves excess space may allow impacts. The right choice depends on the product’s shape, weight, fragility, and route.
Damage reporting turns an isolated complaint into useful operating data. Record the shipment identifier, product or component, visible damage, carton condition, pallet position, and handling stage when observed. Photographs of the item and packaging preserve details for review. Compare reports by product, route, carrier, and warehouse shift to find recurring patterns.
Root-cause analysis should link the damage location to a plausible failure mechanism. A crushed lower carton points to compression or stacking; a shifted product may indicate inadequate restraint or internal support. Review warehouse storage, loading, transportation mode, and transfer points together. This helps distinguish packaging issues from handling or route exposure, so teams can target changes without adding material to every shipment.
Track corrective actions against subsequent damage reports and related costs. If the same component arrives damaged after a packaging adjustment, review handling records and transit conditions next. Recording the outcome also helps determine whether the change improves delivery condition and customer satisfaction.
Insurance premiums and shipping partner scrutiny
Repeated freight damage can affect insurance reviews and relationships with shipping partners. Clear records help businesses understand responsibility, document losses, and address recurring problems.
Insurers may review claim frequency, shipment values, packaging, and transit conditions when assessing risk. Repeated losses can lead to higher premiums and closer scrutiny from insurers and shipping partners. Link each claim to its shipment, product, damage type, and recovery outcome. This helps operations teams identify whether problems cluster around a route, handling point, or product configuration.
Carrier responsibility depends on the shipment terms and carrier type. The Carmack Amendment governs carrier liability for interstate trucking in the United States. For common or contract carriers, the carrier generally bears responsibility for loss or damage, although a bill of lading may limit liability. Depending on the carrier and sale terms, the shipper, carrier, or recipient may bear the financial responsibility.
Parcel limits also require attention. That limit can leave a gap between the shipment’s declared value and the amount recoverable. Review applicable shipping terms and insurance coverage before dispatch, especially for high-value goods.
Receiving procedures also affect recovery. Inspect delivered freight promptly, note visible damage on receiving documents, and photograph the packaging and product. Keep shipment identifiers, the invoice, and inspection records together. These steps create a clearer claim file and link damaged goods to their original shipment.
Ecommerce parcels face repeated handling across distribution networks. The average ecommerce package is dropped 17 times during its journey to the customer. Small impacts can weaken packaging or harm a product over time, even when the outer carton shows limited damage. Packaging testing that reflects distribution conditions can help reveal vulnerabilities before they contribute to customer complaints or claims.
Review shipping partners using consistent measures, including damage reports, claim outcomes, and customer feedback. A pattern of negative receiving reports may warrant a joint review of handling practices, shipment routes, or packaging performance. Keep findings specific by comparing similar products and routes rather than drawing conclusions from unrelated freight.
For a shipment with recurring damage, compare claim records with packaging configuration and transit conditions before changing coverage alone. A targeted packaging review can help identify preventable exposure alongside insurance needs. Request a packaging quote with product dimensions, weight, and shipping requirements for a focused review.
Declared-value coverage requires an additional fee, while repeated losses can lead to higher insurance premiums. The cost depends on the applicable coverage and shipping terms.
OEM Materials & Supplies
OEM Materials & Supplies helps industrial teams address transit damage with packaging suited to their products and shipping needs. For manufacturers in Orange County, Los Angeles, San Diego, and Riverside, custom corrugated boxes, foam protective packaging, and assembled packaging kits can support protection plans based on product dimensions, handling, and distribution conditions. The right configuration depends on the product and the risks identified through damage records or testing.
For example, foam packaging can help limit movement inside a carton, while an assembled packaging kit can bring selected components together for a repeatable packing process. Compare these options with damaged-unit costs to weigh protection needs against material use and packing work.
Contact OEM Materials & Supplies to discuss packaging requirements for your products and shipments.
Turn Damage Data Into a Packaging Decision
The financial impact of product damage in transit is easier to manage when packaging decisions reflect a specific product and shipping profile. Use damage records to identify which products need a packaging review, then define performance requirements before changing materials or packing methods.
For a useful assessment, gather product dimensions and weight, current packaging, shipment conditions, and recorded damage patterns. This gives purchasing, operations, and engineering teams a shared basis for discussing protection and material use. After making a change, keep tracking outcomes so future packaging decisions reflect actual distribution experience.
OEM Materials & Supplies can help industrial teams consider packaging options for their shipping requirements. Request a packaging quote and share your product and shipment details to start the conversation. A more deliberate packaging decision can support a more controlled, dependable distribution process.
Frequently Asked Questions
What Are Freight Damage Rates?
A freight damage rate is the share of shipments or units recorded as damaged within a defined period. To calculate it, choose a denominator: shipments, cartons, pallets, or individual products, and use that definition consistently. For example, tracking damaged cartons separately from affected units can reveal whether a small number of shipments account for multiple product losses. State the measurement basis alongside each rate.
What are the direct and indirect financial impacts of in-transit product damage?
The financial impact depends on how damage changes the costs and revenue associated with an order. For internal reporting, assign each incident a unique case identifier and link it to the affected order, department, and accounting period. This makes it easier to distinguish a one-time adjustment from a recurring operational pattern. Teams can then compare incident trends across periods without treating dissimilar products or orders as equivalent.
How do product damage rates vary by industry, product type, and shipping mode?
Rates vary because products differ in fragility, geometry, weight, and tolerance for movement, while routes involve different handling patterns. Compare like with like: group products by type, packaging configuration, and transport mode before evaluating results. For instance, do not use a damage rate for delicate electronics as a direct benchmark for durable components. Segmenting records this way helps identify meaningful changes rather than differences caused by mixed shipment profiles.
What factors cause product damage during transit, and how can businesses reduce them?
Damage may reflect a mismatch between product protection and the stresses of storage, transfer, and delivery. Assign a consistent incident code, such as impact, compression, movement, or unknown, and record where the issue was first observed. Review recurring codes with the teams responsible for the relevant process. This gives operations a focused way to prioritize investigations and assess whether a corrective change addresses the failure mode.
How do carriers, shippers, and insurers determine liability for damaged goods?
Liability, insurance coverage, and the physical cause of damage are related but separate questions. The shipment agreement and governing transport documents help establish which party accepted responsibility; the policy defines the insurer’s coverage terms. The goods’ condition and available records may inform a claim, but do not by themselves establish coverage. Keep commercial agreements, transport documents, and insurance terms organized as distinct records for review.